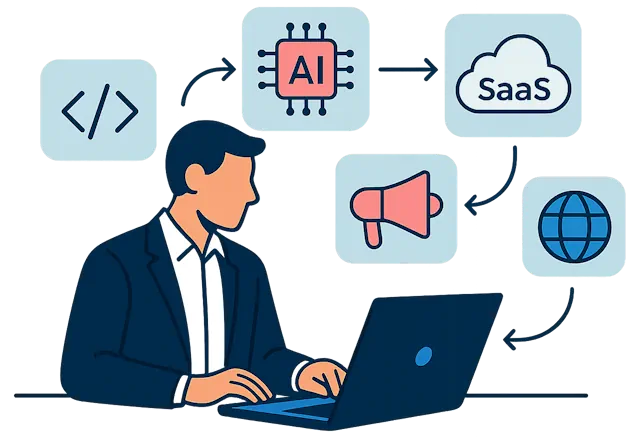


CI/CD Pipelines in 2026: Automate Testing and Deployment (Jenkins, GitHub Actions, GitLab)
By Irene Holden
Last Updated: January 15th 2026

Quick Summary
Yes - CI/CD pipelines are essential in 2026 to automate testing and deployment and to keep pace with higher change volume; mastering resilient pipelines across GitHub Actions, GitLab CI, and Jenkins is now a baseline skill. About 85% of leading tech companies use CI/CD and teams with pipelines ship roughly 60-80% faster, so invest in tests, security scans, and staged deployments. Choose GitHub Actions for GitHub-native projects, GitLab CI for all-in-one GitLab shops, and Jenkins for heavy customization or on-prem needs - Jenkins still leads tool share while Actions and GitLab are widely adopted - and design pipelines to handle the influx of AI-generated PRs.
The Friday rush, in code
Picture that Friday-night kitchen again: the ticket printer never stops, pans are screaming hot, and you’re clinging to a nicely formatted recipe that worked fine in an empty kitchen. That printer is your Git hosting service in 2026 - constant pushes, feature branches, and now a flood of AI-generated pull requests. AI coding assistants are like over-eager prep cooks, cranking out more “orders” (code changes) than you ever saw before. The problem usually isn’t the individual recipe (a sample YAML file or a single deployment script); it’s that there’s no reliable system - the line can’t keep up with the volume.
Why pipelines are now table stakes
Across the industry, delivery has quietly standardized around CI/CD the way restaurants standardize around a functioning line. By 2025, roughly 85% of leading tech companies had CI/CD pipelines for their primary products, and more than 80% of DevOps teams now use some form of pipeline automation. Teams that invest here ship software roughly 60-80% faster than those relying on manual releases, according to synthesized findings from DORA-style studies and overviews such as Middleware’s guide to CI/CD pipelines. In other words: if you’re interviewing for backend or DevOps roles, a working pipeline isn’t a nice personal project - it’s the minimum equipment you’re expected to know how to run.
At the same time, the scope of “the pipeline” has expanded. What started as a simple “run tests on every push” script has evolved into a full kitchen process: CI/CD now routinely includes automated linting, multi-stage testing, dependency and container security scans, infrastructure-as-code validation, and even basic performance or smoke checks. Industry trend analyses like the DevOps reports from RealVNC describe this as a strong “shift-left” movement - pulling quality and security checks forward into the pipeline so problems are caught when they’re cheapest to fix, not when customers are already “sending plates back.”
The AI prep cook and the new volume of change
AI has turned up the heat. Cloud providers are already warning that AI coding assistants will overwhelm traditional delivery setups: AWS, for example, notes that AI tools dramatically increase the number of code changes, making the delivery pipeline - not the coding - the new bottleneck in their analysis of how to prepare for AI-assisted development (AWS Enterprise Strategy blog). You can absolutely ask an AI to draft a GitHub Actions workflow, a GitLab CI file, or a Jenkinsfile, but if you don’t understand triggers, stages, test strategy, and deployment patterns, you’ve just taped a shiny new recipe to the wall without fixing how the line actually runs. A fragile pipeline that works once in a quiet kitchen will crumble under a week of real traffic and AI-generated PRs.
What this guide helps you cook
This guide is about building that resilient kitchen line, not just collecting recipes. You’ll set up a concrete CI/CD pipeline - focusing on GitHub Actions for a Python project, and mapping the same stages to GitLab CI and Jenkins - that behaves like a well-run service: every commit is a ticket, automated tests and security scans act as the head chef’s quick “taste checks,” and deployments move safely through a quiet back line (staging) before they ever hit the dining room (production). The goal is to move you from “I pasted some YAML from a blog” to “I can design a system that keeps up when the ticket printer and the AI prep cooks both go into overdrive.” If you can think like that systems-oriented chef, CI/CD stops being an intimidating buzzword and becomes one of the most valuable, practical skills on your resume.
Steps Overview
- Why CI/CD Matters in 2026
- Prerequisites and Setup
- Understand the CI/CD Landscape and Tool Choices
- Prep Your Station by Structuring Your Repo and Tests
- Build the CI Line with GitHub Actions
- Shift Left on Security with Automated Scans
- Add Continuous Delivery and Safe Deployments
- Adopt GitOps and Observability
- Bring AI into CI/CD Responsibly
- Practice CI/CD as a Career Changer
- Verify Your Pipeline and Test It
- Troubleshooting and Common Mistakes
- Common Questions
Teams planning reliability work will find the comprehensive DevOps, CI/CD, and Kubernetes guide particularly useful.
Prerequisites and Setup
Get your basic ingredients ready
Before you even think about YAML, you need a clean prep station. In kitchen terms, this is your mise en place: the cutting boards are out, the burners work, and your ingredients are labeled. In CI/CD terms, that means a GitHub account, a local Python environment that roughly matches what cloud runners use, and just enough Git knowledge to push changes and open pull requests. Aim for Python 3.10 or 3.11, Git installed, and a free GitHub account tied to a single repository for your Python web or API project.
- Create or sign in to your GitHub account, then create a new repository for your app.
- Install Git and configure your name and email:
git config --global user.name "Your Name"andgit config --global user.email "you@example.com". - Install Python 3.10 or 3.11, then create a virtual environment with
python -m venv .venvand activate it (source .venv/bin/activateon macOS/Linux,.venv\Scripts\activateon Windows).
Prepare your Python project structure
Your project needs to look more like a real kitchen line and less like a junk drawer. A simple, pipeline-friendly layout for a FastAPI, Flask, or Django service looks like this:
.
├── src/               # or your_package_name/
│   └── init.py
├── tests/
│   └── test_example.py
├── requirements.txt
├── requirements-dev.txt
├── pyproject.toml     # optional but helpful for tooling config
└── README.md
Make sure requirements.txt contains your runtime dependencies (FastAPI, Flask, Django, database drivers) and create a separate requirements-dev.txt for tools the pipeline will use but your app doesn’t need at runtime. That separation keeps images smaller and makes it easier to swap or pin tooling without breaking production.
Install dev and test tooling
Automated tests and checks are your head chef doing quick tastes before plates leave the line. Without them, your future pipeline won’t have anything meaningful to run. Add a minimal test to tests/test_example.py so the first CI run doesn’t fail with “no tests found,” and then install a few core tools into your virtual environment:
pip install --upgrade pip
pip install -r requirements.txt

pip install pytest pytest-cov flake8 bandit pip-audit
pip freeze > requirements-dev.txt
This gives you unit testing (pytest), coverage reporting (pytest-cov), style checks (flake8), and basic security scanning (bandit and pip-audit). Guides on CI/CD testing, such as Veritis’s overview of test automation best practices in CI/CD pipelines, consistently stress that reliable automated tests are a prerequisite for fast and safe delivery, not an optional extra.
Know the tools you’ll be touching
Finally, you need to know which “kitchens” you’ll be cooking in. In this guide, you’ll get hands-on with GitHub Actions and see how the same stages map to GitLab CI/CD and Jenkins. Think of GitHub Actions as the built-in line in the same building as your code, GitLab CI as an all-in-one restaurant that owns both dining room and kitchen, and Jenkins as the fully custom setup you assemble yourself. A beginner-friendly comparison of these tools in a LinkedIn guide to GitHub Actions, GitLab CI, and Jenkins echoes this pattern: integrate with where your code already lives first, then worry about exotic setups later. With a clean repo, a virtual environment, and these basics installed, you’re ready to start wiring an actual pipeline instead of just reading recipes.
Understand the CI/CD Landscape and Tool Choices
Start with what CI/CD actually is
Before comparing tools, it helps to know what job they’re all trying to do. Continuous Integration (CI) is the habit of automatically building and testing your code every time you push - like the head chef tasting each component before it hits the plate. Continuous Delivery (CD) extends that by making sure every change can be deployed at any moment, even if a human still has to approve sending it “to the dining room.” Continuous Deployment goes one step further: if the pipeline is happy, code ships to production automatically, no questions asked. In kitchen terms, CI is checking each pan, Continuous Delivery is plating dishes so they’re ready to run, and Continuous Deployment is letting the tickets flow straight from the line to the tables as long as every station passes its checks.
What the landscape looks like in 2026
Behind those concepts is a very crowded tool landscape. Industry surveys show CI/CD is no longer a niche practice: organizations increasingly run more than one pipeline platform, with about 32% using two different CI/CD tools and 9% using three or more, according to aggregated adoption statistics from sources like commandlinux’s DevOps and CI/CD usage report. Tool share is fragmented but fairly stable: Jenkins still leads with roughly 47.13% share, GitHub Actions has around 33%, Azure DevOps sits near 24%, GitLab CI/CD around 9%, and CircleCI at about 5.85%. For a beginner, that can feel like staring at a walk-in fridge packed with unfamiliar ingredients and trying to guess what the chef actually wants you to cook with.
Experts who compare these platforms keep coming back to the same conclusion: context matters more than brand. As one CI/CD comparison noted, “there is no single best tool - selection depends on team size, existing infrastructure, and specific requirements.” - CI/CD tools comparison, TryDirect, summarized in their guide to GitHub Actions vs GitLab CI vs Jenkins. That’s good news for career-switchers: instead of memorizing every tool, you want a solid mental model you can apply across whichever kitchen your future employer runs.
Choosing your main kitchen: Actions, GitLab, or Jenkins
For most people starting in backend or DevOps roles, the real decision is which primary kitchen to learn first. If your code already lives on GitHub, GitHub Actions is usually the most natural fit. If your team is on GitLab, GitLab CI/CD gives you an all-in-one experience. Jenkins still matters in enterprises and legacy environments where teams need deep customization or strict on-prem control. You can think of the tradeoffs like this:
| Tool | Kitchen analogy | Best fit | Key tradeoff |
|---|---|---|---|
| GitHub Actions | Modern line built into your apartment | GitHub-native repos, small and mid-sized teams, personal projects | Very easy to start; less control over underlying infra |
| GitLab CI/CD | Restaurant that owns dining room and kitchen | Orgs wanting repo, CI, and security in one platform | Tighter integration; you’re all-in on GitLab’s ecosystem |
| Jenkins | Custom kitchen you assemble from parts | Large enterprises, legacy stacks, strict self-hosting | Maximum flexibility; higher setup and maintenance overhead |
AI, volume, and why your choice matters
With AI assistants acting as over-eager prep cooks, your ticket printer (Git) will spit out more changes than ever: refactors, auto-generated tests, dependency bumps, tiny “fix lint” commits. That higher volume makes the pipeline itself - not your editor - the real constraint. The good news is that once you understand the core stages (checkout, build, test, scan, deploy), triggers (push vs pull request), and deployment strategies (staging, blue-green, canary), you can translate that system between GitHub Actions, GitLab CI, and Jenkins without starting over. For career-switchers, that’s the real skill employers are hunting for: not “I memorized one YAML syntax,” but “I can design a pipeline that keeps up when the AI and the ticket printer both go into overdrive.”
Prep Your Station by Structuring Your Repo and Tests
Lay out your line: repo structure
If your repository is a random pile of files, your future pipeline will feel like trying to cook service with ingredients scattered all over the floor. You want a clear, predictable layout so tools - and future teammates - always know where the “stations” are. A simple structure that works well with GitHub Actions, GitLab CI, and Jenkins looks like this:
.
├── src/               # or your_package_name/
│   └── init.py
├── tests/
│   └── test_example.py
├── requirements.txt
├── requirements-dev.txt
├── pyproject.toml     # optional, but useful for tooling config
└── README.md
Keep application code under src/ (or a named package), and keep tests in tests/. That simple separation stops “kitchen spillover” where tests and app logic get mixed, and it lets your CI jobs target exactly what they need to run or lint without complex glob patterns.
Add tests so the line has something to taste
Automated tests are your head chef doing quick tastes before anything hits the dining room; without them, your pipeline is just moving raw ingredients around. At minimum, add a single pytest so your first CI run doesn’t fail with “no tests collected.” For example, in tests/test_example.py:
from src import version

def test_version_not_empty():
    assert version
Then run pytest locally to confirm it passes. As you grow, follow the guidance from CI/CD testing best-practice roundups like Wonderment Apps’ CI/CD pipeline best practices, which stress building up layers of tests (unit, integration, API) that can run automatically on every change. Pro tip: once you have your pipeline wired, intentionally break this test and push - seeing the build fail is how you prove the “taste check” is actually wired into the line.
Define a simple branching model the pipeline can trust
Next, you need a basic ticket flow so the printer isn’t just spewing chaos. A simple, pipeline-friendly branching model looks like this:
- main: always deployable; treat it like plates ready for the dining room.
- feature/*: individual “experiment” branches for new work.
- Pull requests: everything merges into
mainvia PRs, never direct pushes.
In GitHub, protect main so it requires at least one review and passing status checks from your CI workflow before merging. That mirrors a real kitchen where nothing leaves without a final check. Guides on modern DevOps practice, such as the overview from eSparkInfo’s DevOps best practices, call out enforced reviews and automated checks on the main branch as a key pattern for keeping releases stable while teams move fast. With a clean structure, a minimal test, and a clear branch strategy, your station is finally prepped for the pipeline work that comes next.
Build the CI Line with GitHub Actions
Wire up your first workflow file
Now that your repo and tests are laid out, it’s time to build the main line: a CI job in GitHub Actions that automatically runs on every ticket the printer spits out (every push or pull request). GitHub Actions is built directly into GitHub, which is one reason many surveys describe it as a default choice for cloud-hosted projects; JetBrains’ CI tools survey highlights how quickly Actions has been adopted alongside older tools like TeamCity and Jenkins for modern workflows (Best Continuous Integration Tools survey). To create your first workflow, do this in the root of your project:
- Create the workflows folder:
mkdir -p .github/workflows - Create the CI file:
touch .github/workflows/ci.yaml
Add a test-and-lint job
Open .github/workflows/ci.yaml and paste in a workflow that checks out your code, sets up Python, installs dependencies, lints, and runs tests with coverage. Think of each step as a mini-station on the line, all coordinated under one ticket:
name: CI

on:
  push:
    branches: [ "main", "develop", "feature/**" ]
  pull_request:
    branches: [ "main" ]

jobs:
  test:
    runs-on: ubuntu-latest

    strategy:
      matrix:
        python-version: ["3.10", "3.11"]

    steps:
      - name: Checkout code
        uses: actions/checkout@v4

      - name: Set up Python
        uses: actions/setup-python@v5
        with:
          python-version: ${{ matrix.python-version }}
          cache: "pip"

      - name: Install dependencies
        run: |
          python -m pip install --upgrade pip
          pip install -r requirements.txt
          if [ -f requirements-dev.txt ]; then pip install -r requirements-dev.txt; fi

      - name: Lint with flake8
        run: flake8 src tests

      - name: Run tests with coverage
        run: |
          pytest --maxfail=1 --disable-warnings \
                 --cov=src --cov-report=xml

      - name: Upload coverage report
        uses: actions/upload-artifact@v4
        with:
          name: coverage-xml
          path: coverage.xml
This one job already gives you parallel “burners” via the matrix (Python 3.10 and 3.11), a cached dependency install, linting, and a coverage report saved as an artifact for later inspection.
Run it and treat failures as feedback
Save the file, then commit and push so GitHub can pick it up. From your terminal:
git add .github/workflows/ci.yamlgit commit -m "Add basic CI pipeline"git push origin your-branch
Head to the “Actions” tab in your GitHub repo and you should see the workflow running automatically on that push. If something fails - maybe flake8 finds an unused import or pytest can’t discover tests - treat that as the chef catching a problem before the plate leaves the line, not as an error to ignore. As the team at Harness notes in their CI/CD best practices, pipelines work best when you automate everything meaningful:
“The principle is straightforward: if a step can be automated, it should be.” - Harness, Best Practices for Awesome CI/CD
Know what each part of the workflow does
Understanding the pieces now will pay off later, especially when AI tools start suggesting edits to this file. GitHub Actions workflows are just structured recipes: a workflow contains one or more jobs, each job runs on a runner, and each runner executes a list of steps. You can map that to the kitchen like this:
| Concept | Kitchen analogy | Example in this file | Where it lives |
|---|---|---|---|
| Workflow | Full menu for a service | name: CI |
.github/workflows/ci.yaml |
| Job | A single station on the line | jobs: test: |
Under jobs: in the YAML |
| Runner | The physical stove and counter | runs-on: ubuntu-latest |
Configured per job |
| Step | One action like chopping or searing | - name: Lint with flake8 |
Inside each job’s steps: |
AI assistants can happily generate or tweak this YAML, but only when you understand these foundations can you design a pipeline that holds up under real Friday-night pressure: multiple Python versions, frequent pushes, and a constant stream of automated and human-written pull requests all hitting the same reliable CI line.
Shift Left on Security with Automated Scans
Bring the safety checks to the front of the line
In a real kitchen, you don’t wait until a plate is at the pass to wonder if the chicken is cooked through; the chef is tasting and checking all the way down the line. “Shift left” security is the same idea in your pipeline: instead of running a giant, slow security scan right before release, you add small, fast checks directly into CI so every commit gets a basic safety check. DevSecOps guides, like a Medium overview of CI/CD and DevSecOps best practices, emphasize this pattern because catching vulnerabilities while code is still on a feature branch is dramatically cheaper than discovering them after a production incident.
Add automated Python security checks to your CI
You’ve already got tests and linting; now you’ll add a dedicated security “station” that only runs if the basic cooking (tests) succeeds. This job installs two tools: pip-audit for dependency vulnerabilities and bandit for static code analysis. In your .github/workflows/ci.yaml, append a new job:
  security:
    runs-on: ubuntu-latest
    needs: test    # only run if tests succeed

    steps:
      - name: Checkout code
        uses: actions/checkout@v4

      - name: Set up Python
        uses: actions/setup-python@v5
        with:
          python-version: "3.11"
          cache: "pip"

      - name: Install dependencies
        run: |
          python -m pip install --upgrade pip
          pip install -r requirements.txt
          pip install pip-audit bandit

      - name: Dependency vulnerability scan (pip-audit)
        run: pip-audit

      - name: Static security analysis (Bandit)
        run: bandit -r src
- Save the file and commit the change:
git commit -am "Add security scanning job". - Push your branch and watch the new
securityjob appear in the Actions tab. - Optionally, temporarily downgrade a library to a known vulnerable version to see
pip-auditfail the build, then revert.
Turn on platform security features too
These Python tools are like a line cook double-checking ingredients; your platform can add a second set of eyes. On GitHub, enable the dependency graph and Dependabot alerts, secret scanning, and code scanning (e.g., CodeQL) from the “Security” tab of your repo. Modern security-focused CI/CD guidance, such as TestMu’s best practices for CI/CD pipelines, highlights integrating SAST (static analysis), dependency scanning, and secret detection directly into the pipeline so issues are blocked at pull request time instead of quietly slipping into main.
Tune the checks so they help, not hinder
Out of the box, security tools can be noisy. Treat them like a new sous chef: start strict enough that real risks (like critical CVEs or obvious unsafe code patterns) fail the build, but be ready to tune. Most teams introduce allowlists or baselines for known acceptable issues, and then ratchet standards tighter over time. This becomes even more important as AI tools generate more code and more dependencies; your security stage is the safety net that keeps that extra volume from turning into extra risk. Get into the habit of reading why a scan failed, fixing the root cause where possible, and only suppressing findings when you fully understand the tradeoff. That’s what turns “we ran a scanner once” into a reliable safety process baked into your CI line.
Add Continuous Delivery and Safe Deployments
Move from tests to delivery
Once your CI is reliably running tests and security checks, the next step is getting finished “plates” out to real users without burning the whole service. That’s the difference between CI and Continuous Delivery: instead of just verifying code, your pipeline now builds artifacts and pushes them through a quiet back line (staging) before anything hits the busy front line (production). Continuous deployment goes one step further by auto-shipping every passing change, but most teams start with Continuous Delivery plus a manual approval for production. Practical guides to robust pipelines, like Nilebits’ walkthrough of “bulletproof” CI/CD pipelines, stress the same pattern: make deployments repeatable, automate them, and put guardrails around production.
Build and push a Docker image from CI
To move from “tests pass” to “this is deployable,” you first need a consistent package to ship. In most modern stacks, that’s a Docker image. Add a job to your GitHub Actions workflow that runs only on pushes to main, after tests and security scans succeed:
  build_and_push:
    runs-on: ubuntu-latest
    needs: [test, security]
    if: github.ref == 'refs/heads/main' && github.event_name == 'push'

    permissions:
      contents: read
      packages: write

    env:
      IMAGE_NAME: ghcr.io/${{ github.repository }}/app

    steps:
      - name: Checkout code
        uses: actions/checkout@v4

      - name: Log in to GitHub Container Registry
        uses: docker/login-action@v3
        with:
          registry: ghcr.io
          username: ${{ github.actor }}
          password: ${{ secrets.GITHUB_TOKEN }}

      - name: Build and push Docker image
        uses: docker/build-push-action@v5
        with:
          context: .
          push: true
          tags: |
            ${{ env.IMAGE_NAME }}:${{ github.sha }}
            ${{ env.IMAGE_NAME }}:latest
- Create a
Dockerfilein your repo root that can build your Python app. - Commit this new job and push to
main. - Verify in GitHub’s “Packages” tab that images with both the commit SHA and
latesttags are being published.
Pro tip: always deploy the exact image tag built by CI (for example, the commit SHA), not latest, so you can roll back precisely if something goes wrong.
Deploy to staging and protect production
With images publishing, you can add two more stations to your line: one that updates a staging environment automatically, and another that updates production only after a human approves the ticket. Assuming you deploy to Kubernetes, add a staging job:
  deploy_staging:
    runs-on: ubuntu-latest
    needs: build_and_push
    environment:
      name: staging
      url: https://staging.your-app.example.com

    steps:
      - name: Checkout code
        uses: actions/checkout@v4

      - name: Set up kubectl
        uses: azure/setup-kubectl@v4
        with:
          version: 'latest'

      - name: Configure kubeconfig
        run: |
          mkdir -p $HOME/.kube
          echo "${{ secrets.KUBE_CONFIG_STAGING }}" > $HOME/.kube/config

      - name: Deploy to staging (rolling update)
        run: |
          kubectl set image deployment/your-app your-app=${{ env.IMAGE_NAME }}:${{ github.sha }} -n staging
          kubectl rollout status deployment/your-app -n staging
Then add a production job that uses a protected “production” environment in GitHub (configured in repo settings to require approval):
  deploy_production:
    runs-on: ubuntu-latest
    needs: deploy_staging
    environment:
      name: production
      url: https://your-app.example.com

    steps:
      - name: Checkout code
        uses: actions/checkout@v4

      - name: Set up kubectl
        uses: azure/setup-kubectl@v4
        with:
          version: 'latest'

      - name: Configure kubeconfig
        run: |
          mkdir -p $HOME/.kube
          echo "${{ secrets.KUBE_CONFIG_PROD }}" > $HOME/.kube/config

      - name: Deploy to production (rolling)
        run: |
          kubectl set image deployment/your-app your-app=${{ env.IMAGE_NAME }}:${{ github.sha }} -n production
          kubectl rollout status deployment/your-app -n production
This uses a rolling update by default, but you can evolve toward blue-green or canary strategies that CircleCI describes as core tools for minimizing downtime in their article on canary vs blue-green deployments. As that guide puts it:
“Canary deployments allow you to expose a change to a small subset of users, monitor the impact, and only proceed when you’re confident it’s safe.” - CircleCI Editorial Team, CircleCI
Warning: never wire your pipeline to deploy directly to production on every push without a staging environment and at least basic monitoring; you’re effectively serving untested dishes straight to customers.
Compare rollout strategies and map to other tools
Whether you’re on GitHub Actions, GitLab CI, or Jenkins, the deployment “menu” is the same; only the syntax changes. You still define stages like test, build, deploy_staging, and deploy_production, and choose a rollout style that fits your risk tolerance and infrastructure budget. In GitLab, those become stages in .gitlab-ci.yml; in Jenkins, they’re pipeline stages in a Jenkinsfile. The big decision is how new versions meet real traffic:
| Strategy | How it routes traffic | Risk profile | Infra cost |
|---|---|---|---|
| Rolling | Updates instances gradually in-place | Moderate; issues spread as rollout proceeds | Low; reuses existing capacity |
| Blue-Green | Switches all traffic from “blue” to “green” at once | Low; instant rollback by flipping traffic back | High; needs duplicate environments |
| Canary | Sends a small percentage of traffic to the new version first | Low to moderate; problems caught on a small slice of users | Medium; some extra capacity and routing logic |
The YAML you just wrote gives you a solid, low-cost starting point: rolling updates to staging and production with a manual approval gate. As your confidence and monitoring mature, you can extend the same stages into blue-green or canary patterns on any CI/CD platform, turning your pipeline from “it deploys” into “it deploys safely, even on a Friday night when the ticket printer never stops.”
Adopt GitOps and Observability
Treat Git as your single source of truth
Once deployments are automated, the next failure mode is drift: what’s running in production slowly stops matching what’s in your configuration files. GitOps tackles this by treating Git as the master inventory sheet for everything, not just app code. In a GitOps setup, your Kubernetes manifests, Helm charts, and even Terraform live in Git alongside your services; tools like Argo CD or Flux continuously compare the live cluster to what’s in the repo and reconcile differences. Industry trend analyses report that GitOps adoption reached roughly 64% by 2025, and about 81% of teams using it saw higher reliability and consistency as a result, reflecting how powerful it is to have one canonical “mise en place” for both code and infrastructure.
Compared with ad-hoc kubectl commands, GitOps makes your deployments repeatable and auditable. Every change to your environment - new image tag, replica count, or config value - goes through the same pull request flow as application code. CI doesn’t talk directly to the cluster anymore; instead, it updates versioned manifests in a separate “environment” repo, and your GitOps controller takes care of applying them. Guides on modern CI/CD tooling, such as Spacelift’s overview of CI/CD tools and GitOps workflows, highlight this pattern as the natural evolution of pipelines in Kubernetes-heavy shops: Git becomes the contract, the cluster just implements it.
Practical GitOps steps for your Python service
You don’t need a huge platform team to start thinking this way. A simple GitOps flow for the Python app you’ve been building looks like this:
- Create a separate environment repo that holds Kubernetes manifests for staging and production (or Helm charts with values files for each environment).
- Change your CI pipeline so that, after it builds and pushes a Docker image, it opens a pull request in the environment repo updating the image tag for the appropriate deployment.
- Configure a GitOps tool (like Argo CD or Flux) to watch the environment repo and sync changes automatically to your cluster when PRs are merged.
This turns your quiet back line (staging) and busy front line (production) into fully version-controlled setups. Rollbacks become as simple as reverting a commit in the environment repo, and audits are no longer a guessing game - they’re just a git log away. Over time, you can fold in Terraform or other infrastructure-as-code so that databases, networks, and queues are all managed the same way.
Add observability so “deploy succeeded” actually means something
GitOps ensures you know what is running; observability tells you how it’s behaving. A green “deployment succeeded” message from Kubernetes only means pods started; it doesn’t say whether users are seeing timeouts or errors. Robust pipelines therefore treat metrics, logs, and health checks as another line of automated “taste tests” after each rollout. At a minimum, you want application and HTTP health checks, basic service metrics (error rates, latency, throughput), and centralized logs that you can query when something goes wrong. Discussions of production-ready pipelines, like OpenMetal’s guide on optimizing CI/CD on cloud infrastructure, emphasize tying these signals back into your pipeline so you can detect regressions quickly.
As your setup matures, you can wire observability directly into deployment decisions. For example, a canary release might gradually increase traffic only if error rates stay below a threshold and p95 latency doesn’t spike; otherwise, your automation can halt or roll back the rollout. Think of it as the head chef watching the pass: the dish doesn’t “count” as successful just because it left the pan; it has to look and taste right under real pressure. By combining GitOps to keep your environments predictable with observability to keep your users happy, you turn your CI/CD pipeline from a fragile script into a controlled, measurable Friday-night operation.
Bring AI into CI/CD Responsibly
See AI as an over-eager prep cook
AI coding assistants today are like a hyperactive prep cook who never gets tired: they write tests, suggest refactors, and crank out “fix lint” commits all day. That’s great for productivity, but it means your ticket printer (Git) is spewing more orders than ever. Cloud providers have already warned that this flips the bottleneck from coding to delivery - the teams that struggle now are the ones whose pipelines can’t keep up with the new volume of small, frequent changes. If your CI/CD is a fragile demo script, an AI that doubles or triples your pull requests will just expose every weak point faster.
Where AI can actually help inside the pipeline
Used well, AI and ML can make the line smarter instead of just busier. Vendors are already shipping “test intelligence” features that run only the tests impacted by a change, spot flaky tests from history, and re-order suites so high-risk checks run first. Broader DevOps trend reports, like Firefly’s overview of modern DevOps best practices, point to this kind of analytics as a key way to keep pipelines fast while release frequency climbs. Some teams also experiment with AI-driven risk scoring: a service looks at what parts of the codebase changed, who touched them, and how complex the diff is, then labels a deployment as low, medium, or high risk and adjusts gates accordingly.
If you’re just starting out, you don’t need fancy tools to benefit from the same ideas. You can phase it in like this:
- Tag or separate your tests (unit vs integration vs end-to-end) so you can choose which groups to run on each trigger.
- Use coverage reports to see which areas of the code are most critical and ensure they have fast, reliable tests.
- Later, evaluate AI-powered plugins that suggest impacted tests or highlight flaky ones, treating them as helpers rather than decision makers.
Guardrails so AI doesn’t own your releases
The big risk isn’t that AI writes bad YAML once; it’s that no one understands the pipeline well enough to spot when it’s wrong. You still need humans who grasp stages, triggers, environments, and rollout strategies. That’s why many CI/CD best-practice guides stress both automation and discipline - DocuWriter’s piece on essential CI/CD practices puts it plainly:
“Automation should handle the repetitive work in CI/CD pipelines, but teams must keep humans in the loop for decisions that affect reliability and user experience.” - DocuWriter.ai Editorial Team
When you bring AI into your CI/CD, treat it like a new line cook: it can chop, stir, and suggest improvements, but it doesn’t run the pass. A few practical rules of thumb help:
- Never merge or deploy purely on an AI’s say-so; keep human approvals for high-impact changes.
- Review AI-generated workflows and Dockerfiles the same way you’d review a junior developer’s PR.
- Keep your pipeline design simple and explicit so you can debug it under pressure, even if an AI helped write it.
If you understand the system - how code moves from commit to build to test to deployment and back, and where AI is allowed to act - you can safely use these new “prep cooks” to move faster without letting them run the restaurant.
Practice CI/CD as a Career Changer
Start practicing on your own line
As a career changer, the fastest way to make CI/CD feel real is to treat your personal project like a tiny production kitchen. Pick a small Python web or API app and make a simple rule for yourself: the only way code goes live is through your pipeline. That means no more “quick fixes” straight on the server, just like a real line cook can’t sneak plates out without going through the pass. Start by wiring up the CI you’ve already seen (lint, tests, coverage), then gradually add stages: split unit vs integration tests, add a nightly job for heavier security scans, and introduce a basic deployment to a low-cost host.
- Pick or build a small FastAPI/Flask/Django app and put it on GitHub.
- Require every change to go through a pull request that triggers your CI workflow.
- Containerize the app with Docker and deploy it to a cheap host where you control deploys.
- Ban manual changes in production; if something needs fixing, it goes through Git and CI/CD.
Turn practice into portfolio signal
The difference between “I followed a CI tutorial” and “I can run a line” is how well you can explain your setup. Employers hiring juniors or career switchers rarely expect you to have operated a massive enterprise pipeline, but they do care whether you can walk through a concrete example: what triggers your workflow, what stages it runs, what happens when a test fails, and how deployments and rollbacks work. Document this in your README with a short diagram and a few bullet points; treat it like a menu for your pipeline. If you like more structured learning alongside your own project, there are focused courses (for example, a CI/CD for testers class on Jenkins and GitHub Actions) that can help you practice reading and reasoning about real-world pipelines.
Use a bootcamp as a structured kitchen
Not everyone wants to assemble their entire learning path alone, especially while juggling work or family. That’s where a structured program can feel like joining an organized kitchen instead of cooking alone at home. Nucamp’s Back End, SQL and DevOps with Python bootcamp, for example, runs for 16 weeks with a commitment of roughly 10-20 hours per week. It combines Python backend work, PostgreSQL and SQL, and DevOps practices such as CI/CD, Docker, and cloud deployment, all inside one coherent storyline. Tuition starts at about $2,124 with payment plans, and weekly live workshops (about four hours, with at most 15 students per class) give you a place to ask “why does this pipeline stage exist?” instead of just copying YAML. For many career changers, that mix of structure, affordability, and direct instructor feedback is what turns abstract DevOps concepts into muscle memory.
Stand out in an AI-heavy job market
The job market is competitive, and AI has already flooded it with candidates who can generate decent code or YAML on demand. What stands out now is not whether you can write a Dockerfile from scratch, but whether you understand how all the pieces fit together: Python services, SQL databases, CI/CD pipelines, Docker images, and cloud environments. Programs that blend these, like Nucamp’s backend curriculum with its dedicated time on data structures, algorithms, and problem-solving, are designed with that in mind. Combined with your own project where CI/CD is the only way to deploy, you’re no longer just a recipe-following “cook.” You’re practicing how to think like the systems-oriented “chef” who can design and run the whole Friday-night operation - even when the ticket printer and the AI prep cooks won’t stop.
Verify Your Pipeline and Test It
Treat your pipeline like a pre-service check
Before a restaurant opens for dinner, the head chef walks the line: are burners working, sauces hot, plates stacked, tickets printing? Verifying your CI/CD pipeline is the same kind of pre-service ritual. You’re checking that every commit still flows through the same reliable path, that failures stop bad changes, and that deployments do exactly what you expect. Teams that invest in this kind of consistency see fewer surprises and faster, safer releases, a pattern echoed in deployment tooling guides like Octopus Deploy’s overview of CI/CD solutions, which stresses repeatable, auditable release processes.
Functional checks: does CI fire when it should?
Start by confirming that your pipeline behaves correctly when code changes hit the ticket printer (Git). Walk through this checklist on a real repo:
- Every push to any branch triggers your CI workflow.
- Every pull request to
mainruns:- Linting
- Tests (with coverage)
- Security scans (dependencies + static)
- A failing test or scan blocks the PR from merging (via required checks on
main).
“The most effective CI/CD pipelines are the ones where every change follows the same path to production, with no special cases.” - Octopus Deploy Editorial Team
Deployment and safety checks
Next, make sure your delivery flow behaves like a disciplined back line: staging gets every new dish first, production only sees what’s already passed checks, and you can always send a bad dish back. Verify the following:
- A push to
main:- Builds and pushes a Docker image with a unique tag (for example, the commit SHA).
- Deploys that image to staging.
- Uses a manual approval step before deploying to production.
- You can deploy the same image to production that you tested in staging (no rebuilds in between).
- You can intentionally break a test and see the pipeline fail fast.
- You can intentionally introduce a trivial vulnerability (for example, an outdated dependency) and see security scans complain, then revert.
- You have basic metrics and logs for your app in staging/production, even if they’re minimal.
AI-era readiness checks
Finally, pressure-test your setup for an environment where AI assistants are constantly suggesting changes and opening small PRs. You want a line that can handle that ticket volume without constant babysitting. Confirm that:
- Your pipeline can handle multiple PRs per day without manual intervention beyond normal reviews.
- You understand:
- What each stage does.
- What would happen if you removed it.
- Where you might later plug in AI-based testing or risk scoring.
If you can explain your pipeline to another person, break it on purpose and watch it fail safely, and use it as the only path for deploying changes, you’ve moved beyond copying a demo. You’re starting to think like the systems-focused chef described in CI/CD maturity discussions such as DeployFlow’s writing on reliable CI/CD pipelines: someone who can run a Friday-night service even when the ticket printer, and all those AI-powered prep cooks, never stop.
Troubleshooting and Common Mistakes
Even with a solid design, every pipeline hits the same potholes: YAML that won’t parse, workflows that never trigger, tests that pass locally but fail in CI, security tools that scream at everything, or - worst of all - a misconfigured job that ships straight to production. Troubleshooting is part of learning to “run the line”: the goal isn’t a pipeline that never fails, it’s a setup where failures are understandable, fixable, and caught before they reach your users.
Fix “it won’t even run” issues
The first class of problems is structural: your workflow file exists, but nothing seems to happen, or the run fails before it reaches tests. These are like a gas line that isn’t lit or a ticket printer that’s unplugged. To debug:
- Confirm file placement and name:
- File path must be
.github/workflows/<something>.ymlor.yaml. - Ensure it’s committed to the default branch (usually
main).
- File path must be
- Check triggers under the “Actions” tab:
- Open a recent commit and see if any workflow ran.
- If not, verify the
on:section covers your branch and event (for example,pushandpull_request).
- Validate YAML syntax:
- Use an online YAML linter or your editor’s validation.
- Look for tabs (use spaces only), misaligned indentation, and trailing colons.
- Re-run a failed job and read the logs from the top; many early failures are just bad keys or mis-typed action names.
Consultancies that implement pipelines for large organizations, like Kellton in their article on CI/CD best practices for scalable delivery, repeatedly point out that a surprising number of outages trace back to misconfigured pipelines rather than the application itself.
Tame flaky tests and noisy security scans
Once jobs run, the next pain is reliability: tests that pass locally but fail in CI, or security scans that flag so many “issues” that developers start ignoring them. That’s like a station that sometimes burns dishes and a new safety inspector who calls out every smudge. To get things under control:
- Isolate flaky tests:
- Run the suspect test repeatedly:
pytest path/to/test_file.py::test_name -n 1 --maxfail=1. - If it fails intermittently, mark it and quarantine it (for example, with
@pytest.mark.flakyor by moving it to a separate, non-blocking job) while you investigate root causes like timing, dependencies, or shared state.
- Run the suspect test repeatedly:
- Stabilize test environments:
- Use ephemeral test databases and containers so each run starts from a clean slate.
- Avoid relying on external services without mocks or test doubles.
- Prioritize security findings:
- Configure tools like
pip-auditandbanditto fail only on high/critical issues at first. - Maintain a small allowlist for known, documented exceptions and review it regularly.
- Configure tools like
Tool comparison guides such as Katalon’s overview of CI/CD tools and practices stress that test stability and signal-to-noise ratio in security scanning are key differentiators between teams that ship frequently and those that are constantly fighting their own pipelines.
Recover from bad deploys and avoid direct-to-prod mistakes
The scariest class of errors is in deployment: a pipeline that ships straight from main to production with no staging, no approvals, and no easy rollback. That’s like sending dishes straight to the dining room without tasting them and with no plan if a batch is undercooked. Common anti-patterns and their fixes look like this:
| Mistake | Symptom | Quick fix | Longer-term practice |
|---|---|---|---|
| No staging environment | Only discover issues after users complain | Add a staging namespace/app and deploy there first | Run smoke tests and basic checks automatically on staging |
| Direct-to-prod on every push | Every commit can break customers | Require manual approval or scheduled releases for production | Adopt blue-green or canary rollouts with clear promotion rules |
| No rollback strategy | Slow, manual “fix-forward” emergencies | Keep previous image tags and scripts to redeploy them quickly | Use Git-based environment repos so rollback is just a revert |
Modern deployment strategy deep dives, like a DEV Community article on blue-green and canary deployments, emphasize that safe rollouts and fast rollbacks are what separate fragile setups from resilient ones.
“Many outages blamed on ‘bad deployments’ are actually the result of weak rollback and environment strategies, not the code itself.” - Northflank Editorial Team, Northflank CI/CD Blog
The pattern behind all these fixes is the same: treat your pipeline like a real kitchen process, not a one-off script. When something goes wrong, don’t just patch the symptom; adjust the system so the same class of mistake is harder to make next time. That mindset is what turns troubleshooting from a series of emergencies into an everyday part of keeping the line running smoothly.
Common Questions
Can I set up a CI/CD pipeline that reliably automates testing and deployment across GitHub Actions, GitLab CI, and Jenkins so it handles high PR volume?
Yes - focus on core stages (checkout, build, test, scan, deploy) and clear triggers (push vs PR) so the same design maps between GitHub Actions, GitLab CI, and Jenkins. Teams with solid pipelines ship roughly 60-80% faster, and by 2025 about 85% of leading tech companies already relied on CI/CD, so concentrate on resilient patterns, not just YAML syntax.
Which CI/CD tool should I learn first as a career-changer: GitHub Actions, GitLab CI, or Jenkins?
Pick the tool that matches where your code lives: GitHub Actions is the easiest start for GitHub repos (≈33% tool share), GitLab CI is best if your org uses GitLab, and Jenkins matters for large, self-hosted fleets (Jenkins still leads with ~47% share). Employers care more that you understand stages, triggers, and deployment patterns than that you memorized one platform's YAML.
How do I prevent the pipeline from collapsing when AI tools generate lots of small PRs?
Segment tests (fast unit tests on PRs, heavier integration or security scans on merge or nightly jobs), use caching and test matrices, and consider test-intelligence or impacted-test selection to avoid running everything for every small change - cloud providers warn AI will dramatically increase change volume. Also enforce protected main branch checks and required reviews so noisy AI commits can’t bypass gating.
How can I add security scans to CI without overwhelming developers with false positives?
Run lightweight tools like pip-audit and Bandit in a security job that depends on passing tests, fail only on high/critical findings initially, and maintain a small allowlist for reviewed exceptions to reduce noise. Complement that with platform features (Dependabot alerts, CodeQL) and tune thresholds as you improve coverage and test reliability.
What’s the best way to show CI/CD skills on a portfolio or in interviews?
Make a personal project where changes only reach production through the pipeline, document triggers/stages/rollback steps in the README, and include artifacts like build image tags and a history of a failing test that blocked a PR - interviewers want systems thinking, not just copied YAML. If you want structured practice, cohort programs (for example, a 16-week bootcamp averaging 10-20 hours/week) can give guided, end-to-end pipeline experience.
If you need a study plan, this comprehensive learning roadmap for Kubernetes fluency lays out staged milestones from Docker to autoscaling.
Compare notes using the best backend caching and scaling scenarios that interviewers often ask.
See which best scalable e-commerce backend projects employers recognize on GitHub and in interviews.
Compare architectures in the REST vs GraphQL hybrid design tutorial for dashboards and mobile clients.
Career-switchers should follow the complete roadmap for Python, SQL, and DevOps recommended in the article.

Irene Holden
Operations Manager
Former Microsoft Education and Learning Futures Group team member, Irene now oversees instructors at Nucamp while writing about everything tech - from careers to coding bootcamps.